Activity trends
See how work changes over time, for a whole folder or for one person.
Pick a time range
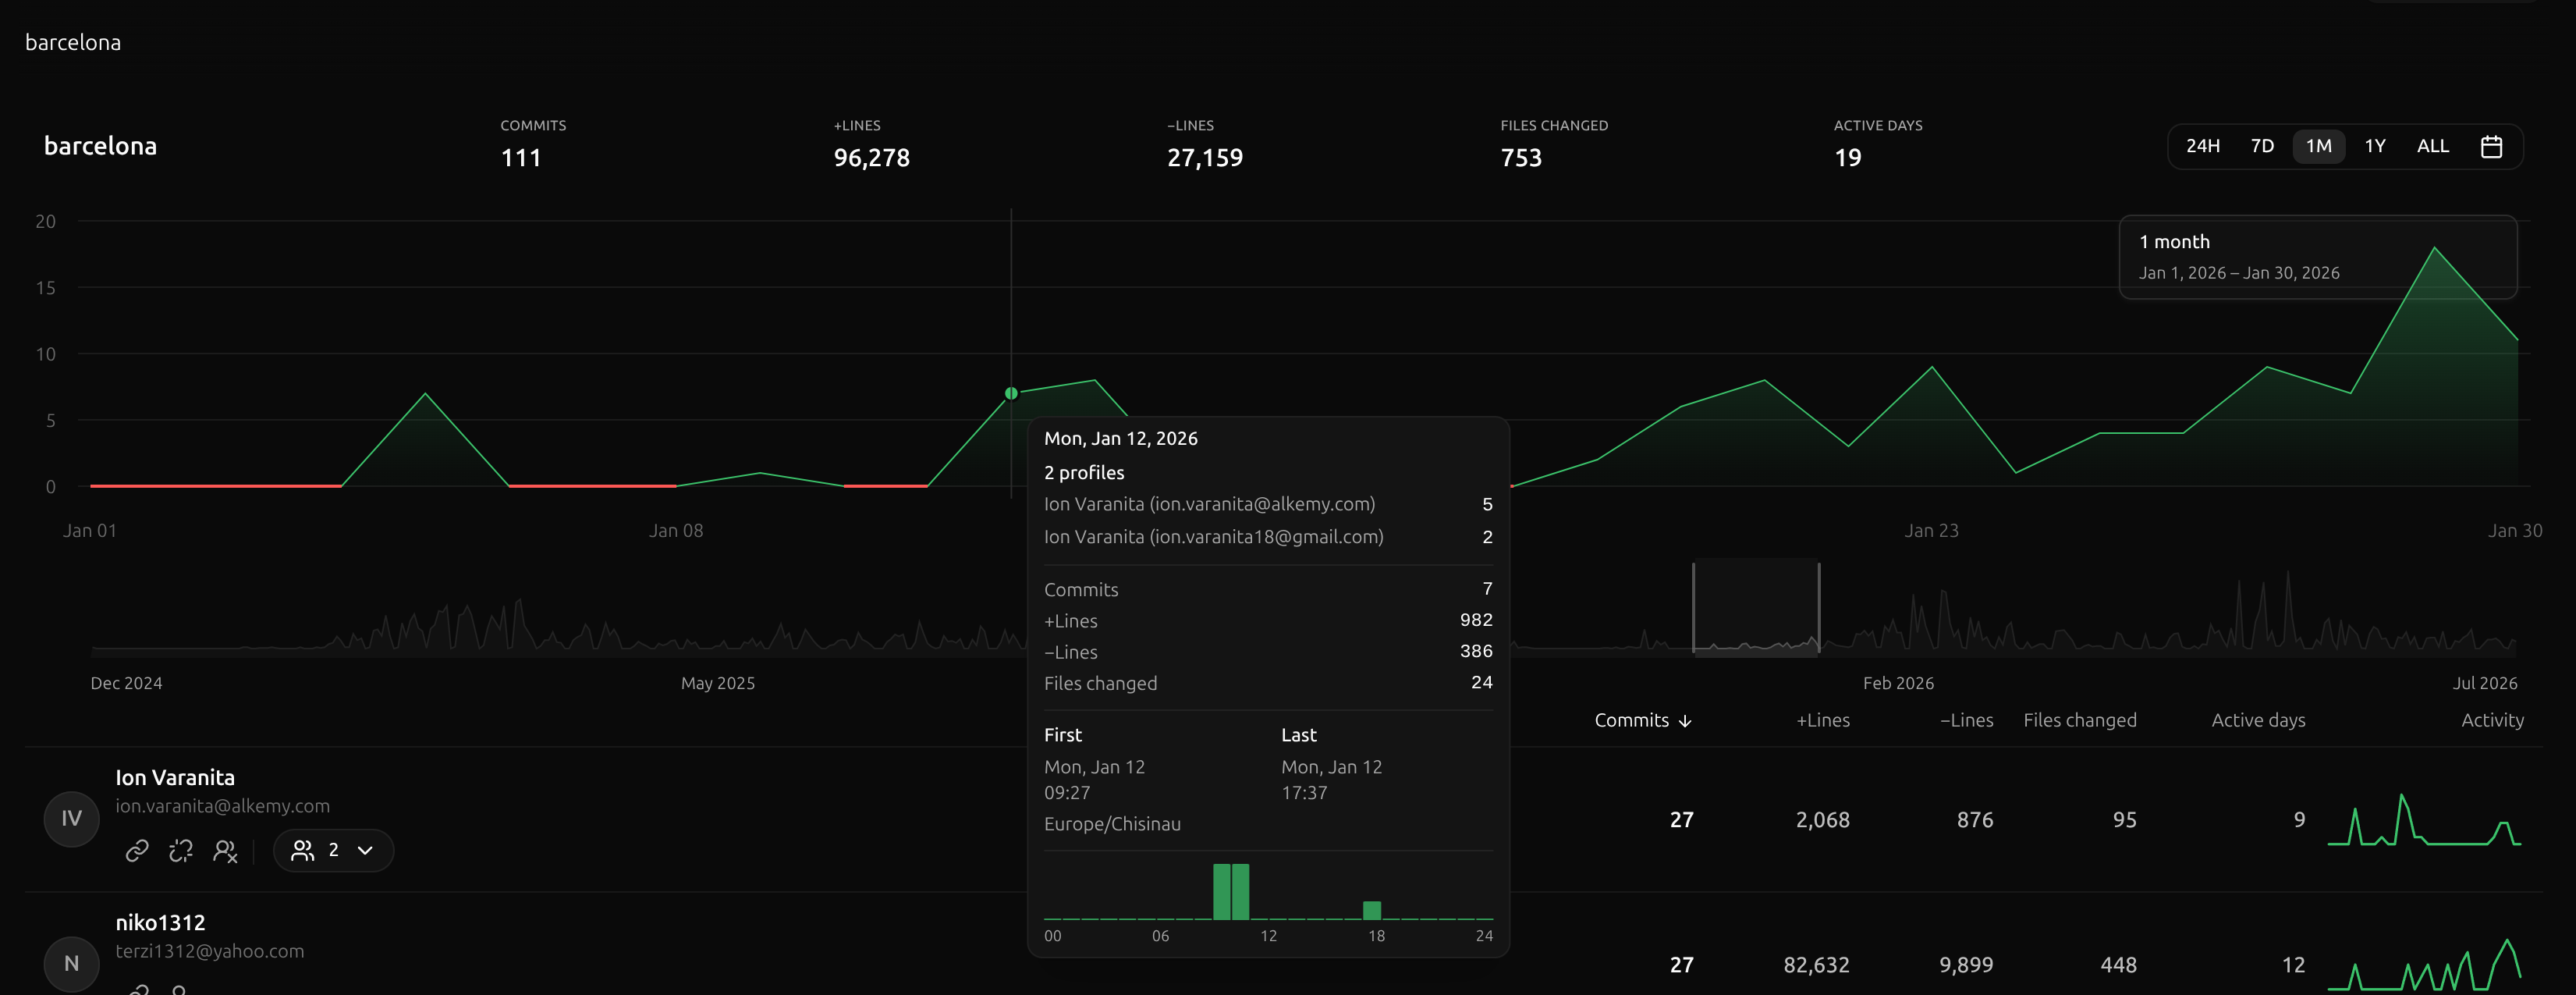
Look at the last day, week, month, or year, or the whole history. You can also drag the highlighted area on the strip below the chart to pick any range.
Explore a day
Hover over the chart to see totals. Click a day to open its details: the day's totals, the people or profiles who contributed, and the times of their first and last commits. Each person has an hourly track on the same scale, so you can read their activity together.
Select a person or profile to open their commits for that day, then open a commit to see which files changed and what was added or removed. You can open these day details from the report chart, a contributor's profile, or the small charts on contributor cards. On the report and profile charts, you can also focus the chart, use the arrow keys to choose a day, and press Enter to open it.
Your time zone
Days are grouped by UTC. Within a day's details, commit times and hourly tracks use the time zone you choose in Settings. Changing that time zone changes the displayed times, not which commits belong to the day.
Quiet days still show
Days with no activity show as zero, so you can see the gaps too.
Plans
Your plan sets how many projects your account can hold and how much history they can have in total. See plans and pricing, or start with Getting started.